Aluminum vs. Recycled PET
aluminum vs. recycled pet - the debate rages on
*Post was originally written on September 24, 2021. You can view a twitter thread summary here. This article compares aluminum and recycled PET packaging using the lifecycle studies and recycling data linked below.
bluf (bottom line up front)
It’s complicated. In the beverage-container studies linked below, lightweight PET water bottles have a lower modeled footprint than the alternatives assessed. That result depends on container weight, recycled content, electricity supply and end-of-life assumptions; it does not establish a universal ranking of virgin PET against virgin aluminum. On a longer-term basis, if the move to a circular economy comes to fruition, aluminum is superior and should win out absent a technological breakthrough in ‘enhanced/chemical’ recycling for plastics. In terms of overall recyclability and economics, aluminum is superior. As emissions from aluminum smelting comes down with the move to renewable energy, Aluminum will be more competitive on a virgin material basis as well. Given demand for packaging is expected to be remain strong, there’s likely a spot for both Aluminum and rPET in the near- and medium-term futures since we won’t decarbonize China overnight and consumers will still desire plastic in some environments. On a longer-term basis, given the better economics, increasingly competitive carbon LCA footprint, and better recycling infrastructure, aluminum may continue to take share. Of note, scrap prices for both aluminum and PET are rising as more companies focus on creating packaging from recycled content.
- What to pay attention to for Aluminum players: As China begins to curb emissions within the country and shut-in some smelting supply, we’re already seeing price impacts to global aluminum prices.
- What to pay attention to for rPET players: Nearly every major beverage company has an initiative around using rPET packaging and it’ll be interesting to track if there are any cost headwinds as a result of the recyclable material not being as readily available as other commodities (due to a lower recycling rate, collection rate, and the fact you downcycle plastic). It will be interesting to see the major players invest more capital into improving PET recycling infrastructure globally as well as in nascent enhanced/chemical recycling technologies.
key considerations:
- Carbon Footprint: Lightweight PET water bottles have the lowest modeled footprint in the cited beverage-container comparisons. Results for other container types depend on the study and region.
- The cited studies use different container designs and recycled-content assumptions. Their rankings should not be treated as a comparison of entirely virgin materials.
- Carbon footprint and life cycle assessments (LCAs) are heavily dependent on the assumptions used (introduces some bias based on who commissions the report) but the conclusions are relatively consistent currently.
- There are also many assumptions to make and they vary by region: factors include materials, manufacturing, weight, transportation, recycling, reusability and end of life disposal; all of which can vary by the region you focus on.
- Sources: Ball Corp had Sphera conduct an analysis in June 2020, IBWA commissioned a study from Trayak in 2021, Imperial College of London did a study in September 2020.
- Recycling Rates: Edge – Aluminum
- Consumer recycling rates (%) are reported to be in the high 40s for Aluminum and mid 20-low 30s for PET (only sources I could find were from two Aluminum-focused trade associations but both came up with similar numbers― #1 and #2)
- Hard to find a neutral source, the global repots commissioned are from Beverage Can trade associations
- For the United States, the EPA reported these 2018 recycling rates for the specified container categories, using its national materials dataset:
- Aluminum beer and soft drink cans—50.4%
- Polyethylene terephthalate (PET) plastic bottles and jars—29.1%
- High-density polyethylene (HDPE) plastic natural bottles—29.3%
- Consumer recycling rates (%) are reported to be in the high 40s for Aluminum and mid 20-low 30s for PET (only sources I could find were from two Aluminum-focused trade associations but both came up with similar numbers― #1 and #2)
- Recycling Quality & Amount: Edge―Aluminum
- Plastic can be recycled one to 10 times, depending on the type (even things like color or printing on it can really impact the recyclability), although most can be recycled only once. Postconsumer plastic is often turned into synthetic fibers, plastic lumber, insulation, and containers—whatever it becomes, though, will inevitably be a lower-quality item than the original product, called "downcycling."
- There are increasing regulations around PET resin for food-grade packaging applications that need to be met so waste contamination is a huge concern here.
- There’s also a difference between mechanical recycling (lower footprint than virgin PET but much less yield) and ‘enhanced/chemical’ recycling (makes the packaging good as new but a higher carbon footprint given the increased energy intensity associated with it).
- Aluminum is one of the most valuable recyclable materials because there is no limit to how many times it can be recycled. *note―sometimes this can be impacted if it has an internal plastic liner
- The big thing about recycled aluminum from an emissions perspective is it takes ~90%+ less energy because you can run it a lower heat. This is also a big point because most virgin aluminum comes from smelters in China who typically often use coal power (which inflates their LCA on a new production basis) so the recycled aluminum’s footprint is far lower than virgin materials
- Plastic can be recycled one to 10 times, depending on the type (even things like color or printing on it can really impact the recyclability), although most can be recycled only once. Postconsumer plastic is often turned into synthetic fibers, plastic lumber, insulation, and containers—whatever it becomes, though, will inevitably be a lower-quality item than the original product, called "downcycling."
Reading the source studies
Chart update, September 17, 2026: the four low-resolution thumbnails have been replaced with readable source summaries and a new chart of the EPA figures cited above. The original article date is unchanged.
- Ball/Sphera, 2020: The comparative study evaluates beverage packaging across regional scenarios. Ball’s European results summary identifies lightweight, non-carbonated-water PET bottles as the lowest-carbon option in that comparison. Container weight, drink type and region matter; this is not a universal ranking of aluminum against PET.
- IBWA/Trayak, 2021: The study’s functional unit is 500 mL of water. It includes primary, secondary and tertiary packaging and US end-of-life assumptions. The PET water bottle has the lowest modeled impact across the seven indicators assessed. See the comparison and limitations on PDF pages 13–16. The industry-average inputs include recycled content, so these results should not be described as a comparison of entirely virgin materials.
- Imperial College London/Veolia, 2020: Examining Material Evidence: The Carbon Fingerprint reviews the carbon implications of replacing plastic with alternative materials. Its wider packaging review has a different scope from the two beverage-container studies.
US container recycling rates, 2018
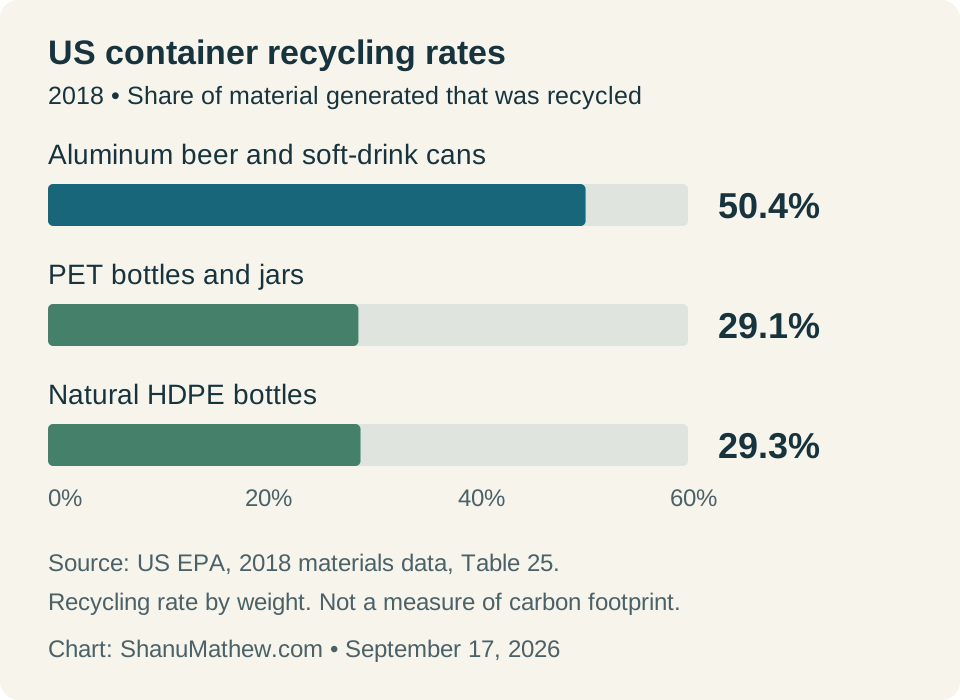
Open the full-size chart. Chart by ShanuMathew.com from EPA’s 2018 materials data, Table 25. These are recycling rates by material weight for the named US container categories. They are neither recycled-content shares nor lifecycle-emissions estimates, and they are not current-year rates.