2024 Cleantech Market Review and 2025 Outlook
The US public equity clean energy transition landscape witnessed remarkable divergence in 2024, creating a compelling narrative of contrasts within the sector.
Executive Summary
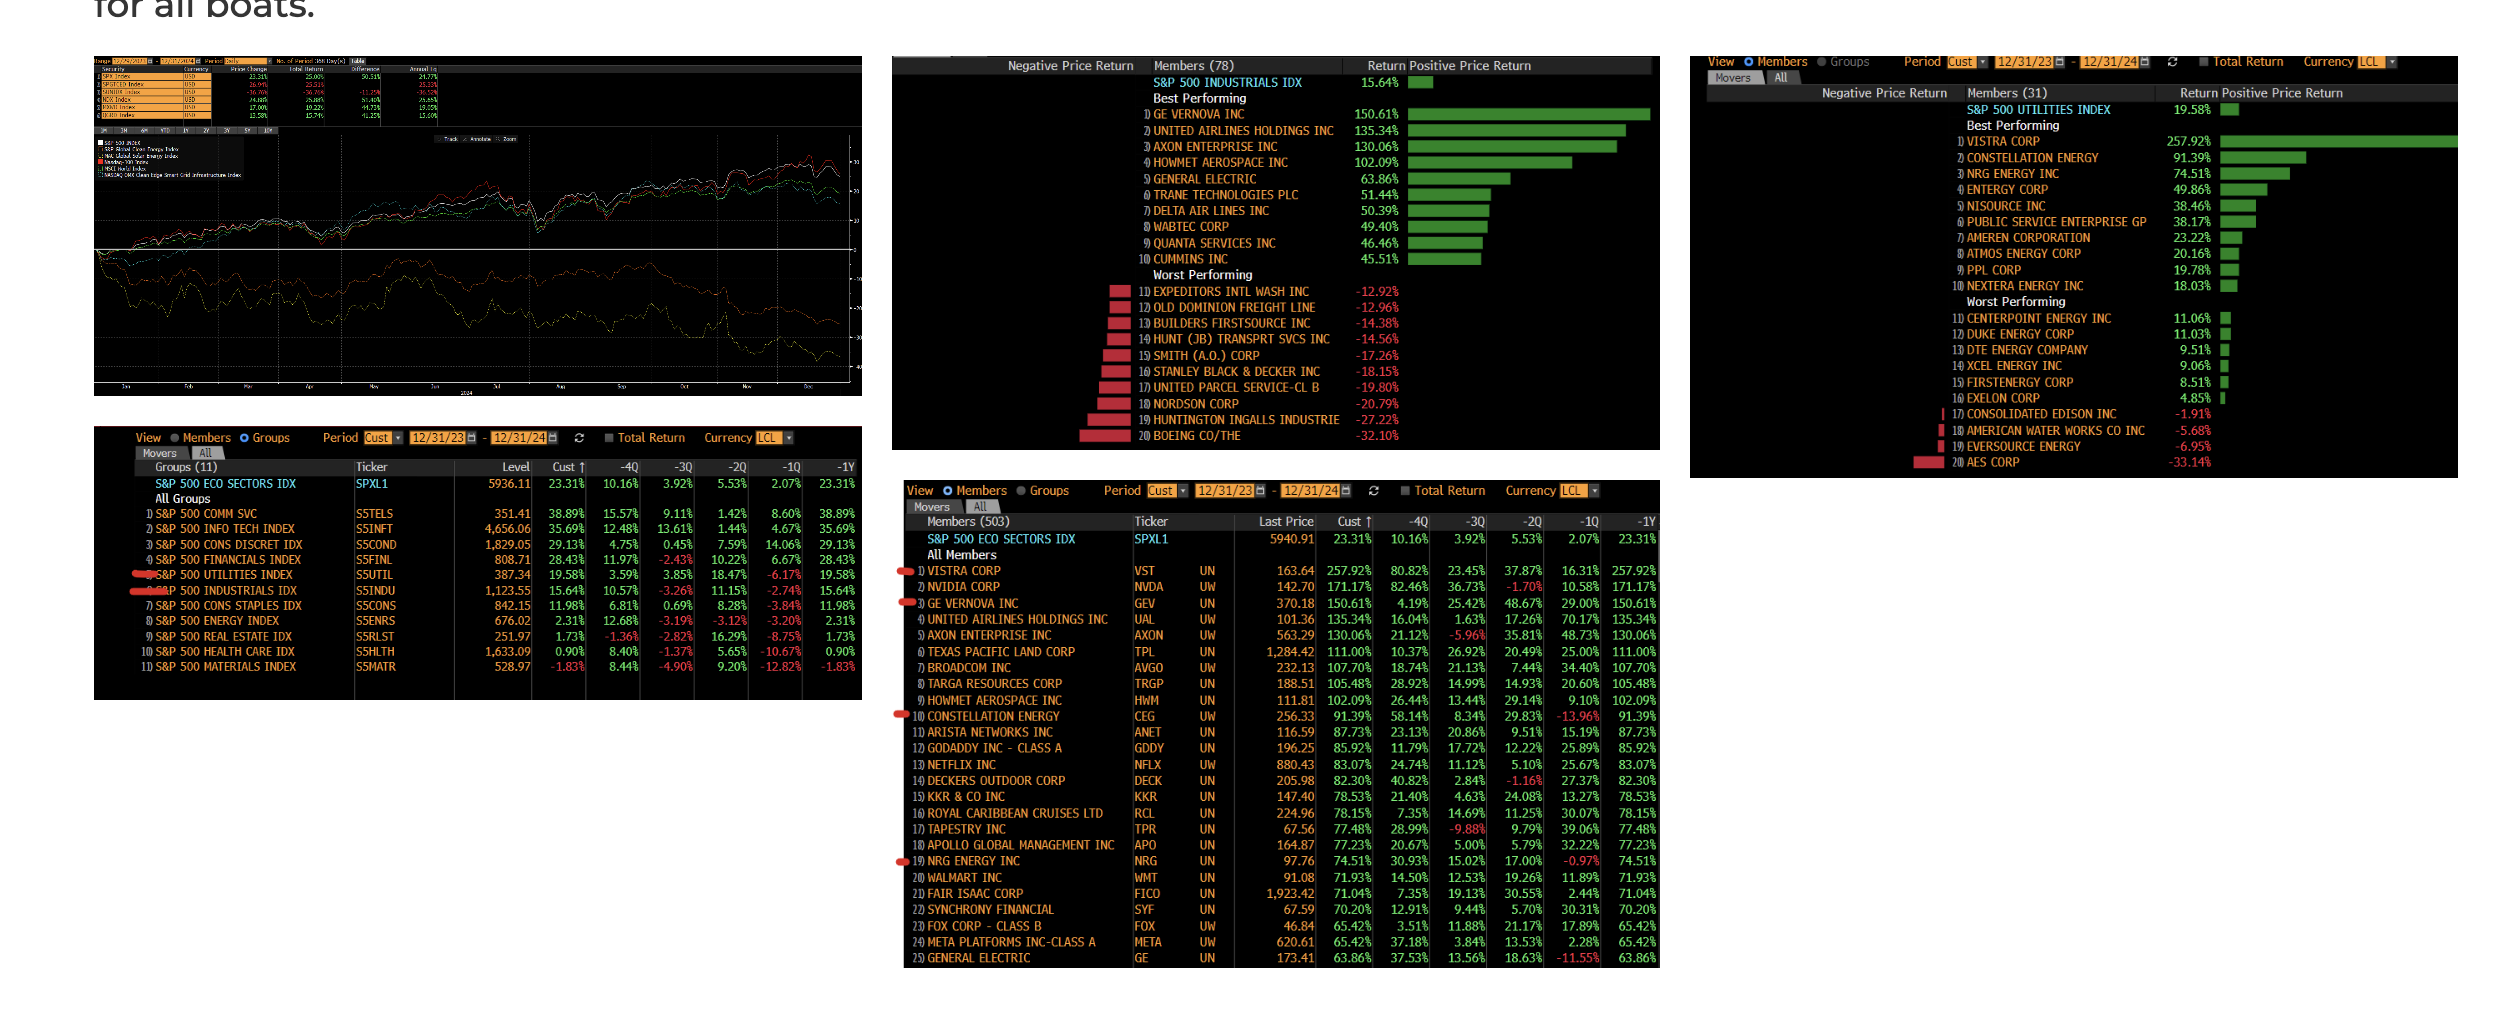
Traditional cleantech segments (solar, wind, batteries, lithium) continued to experience significant headwinds, with indices declining 25-35%+ against a broader market that advanced 25% (see below). However, when you pull apart broader indices, you see many cleantech-adjacent industries (independent power producers in power & energy, pockets of multi-industrial companies: electricals, HVAC, etc.) demonstrated strength, particularly in areas supporting data center infrastructure and utility/grid capex. This divergence highlights a fundamental shift in how the market values different approaches to the energy transition, with established industrial players increasingly capturing the benefits of sustainability-driven tailwinds. I love to always remind folks, secular momentum does not mean that every exposed company benefits. A focus on which companies can capture value via pricing power, tech advantages, scale, etc. will always be more indicative of performance versus any top-down narrative around the transition acting as a rising tide for all boats.
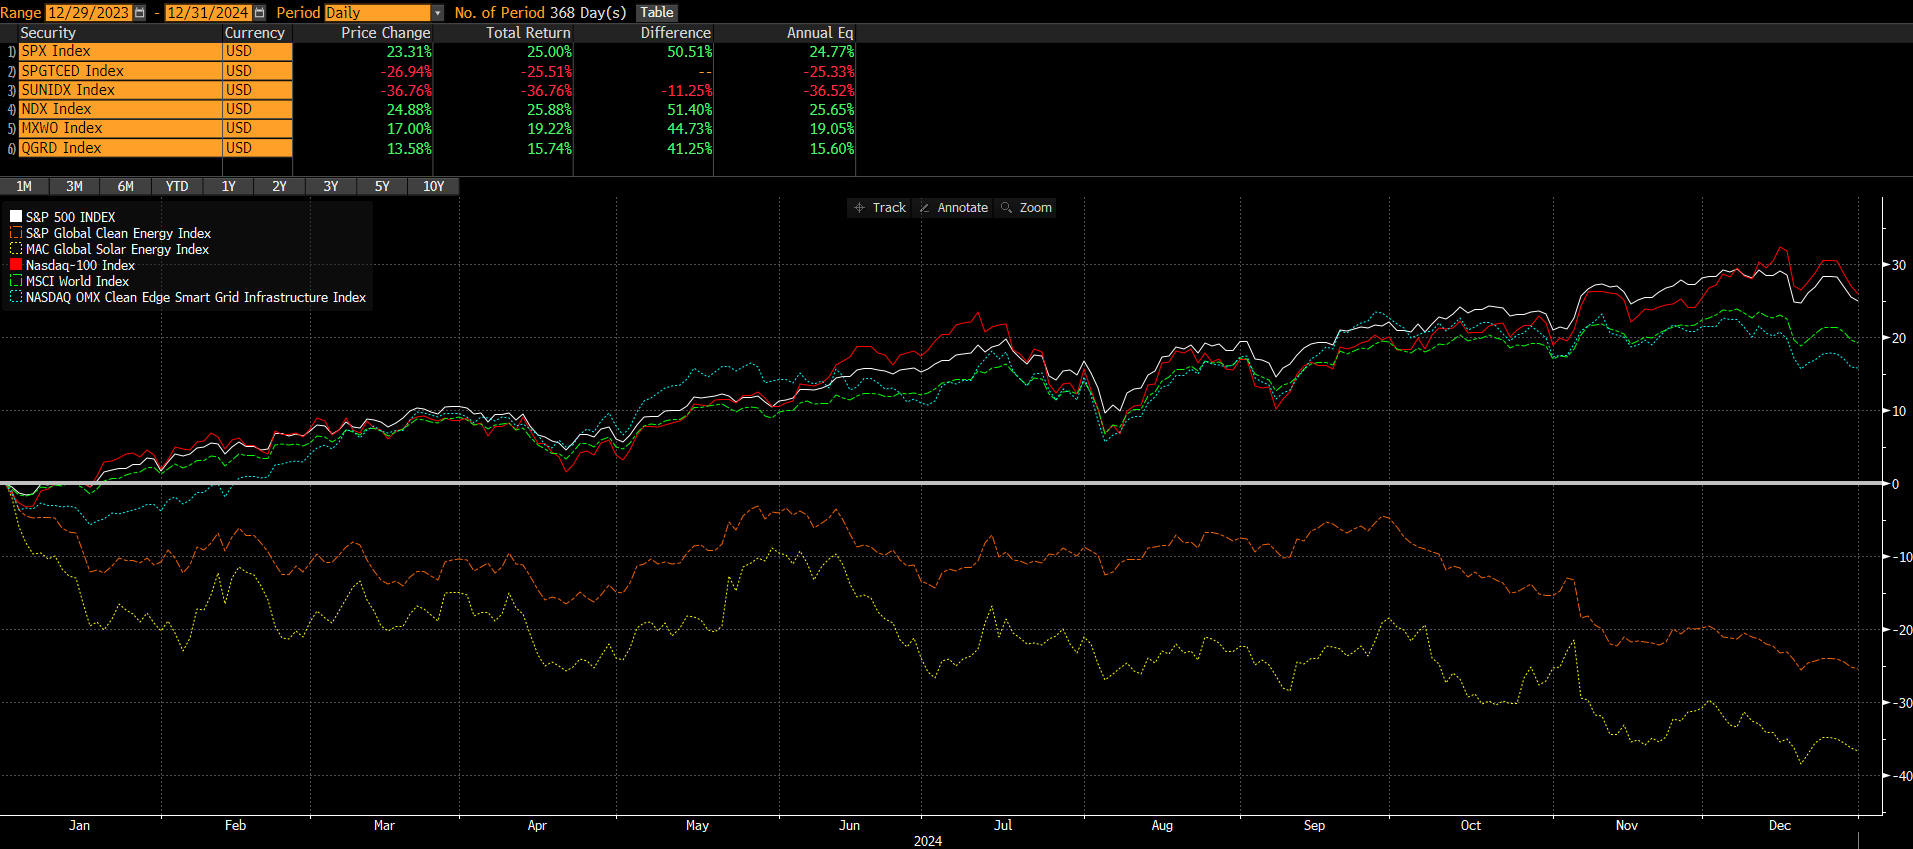
Source: Bloomberg, year-end 2024 snapshot. Open the full-size index comparison.
Open the full-size market-detail panels. This archived January 2025 page screenshot preserves the sector-return table, company-return table and industrials/utilities rankings alongside the index comparison. The individual files for those four additional panels could not be recovered.
I’m sure we’ve all seen some version of this chart below from BNEF that everyone uses to celebrate all the transition spending. But, after the last two years, investors must be asking: where is all the alpha? 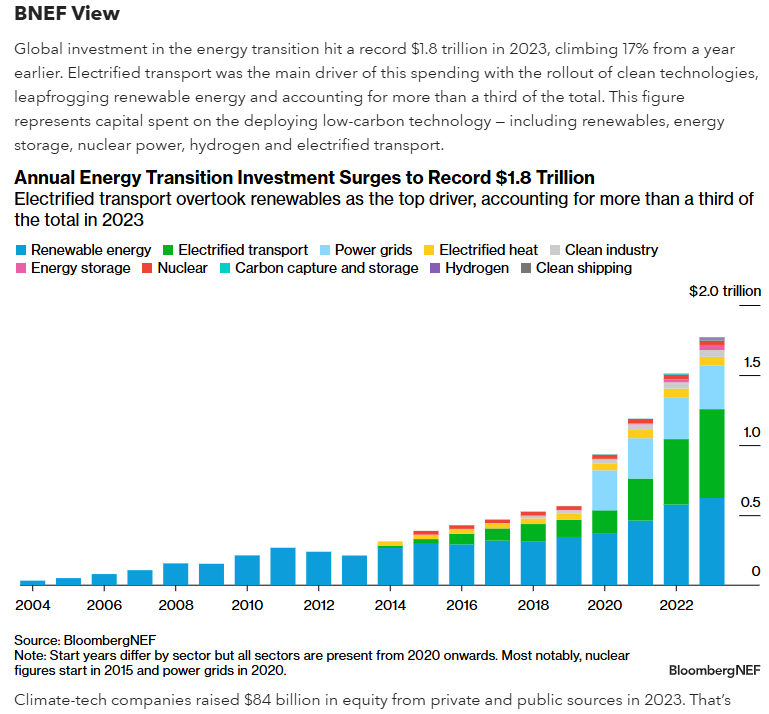
2024 Performance Review: A Tale of Two Markets
1) Traditional Cleantech Challenges
The traditional cleantech sector encountered multiple challenges throughout 2024, leading to significant underperformance that was more of the same that impacted 202.3. Rising interest rates impacted project economics and attractiveness of financing, while power price normalization both in the US and Europe diminished the comparative advantages of renewable energy solutions (this dynamic elongates payback periods and lowers returns). The sector also faced considerable headwinds from end market slowdowns, particularly evident in residential solar installations (e.g., less demand, overstuffed inventories) and electric vehicle adoption rates (growth in the large Chinese market offset by flattening growth in incremental growth markets US and Europe) in key markets. Select Traditional Cleantech Companies 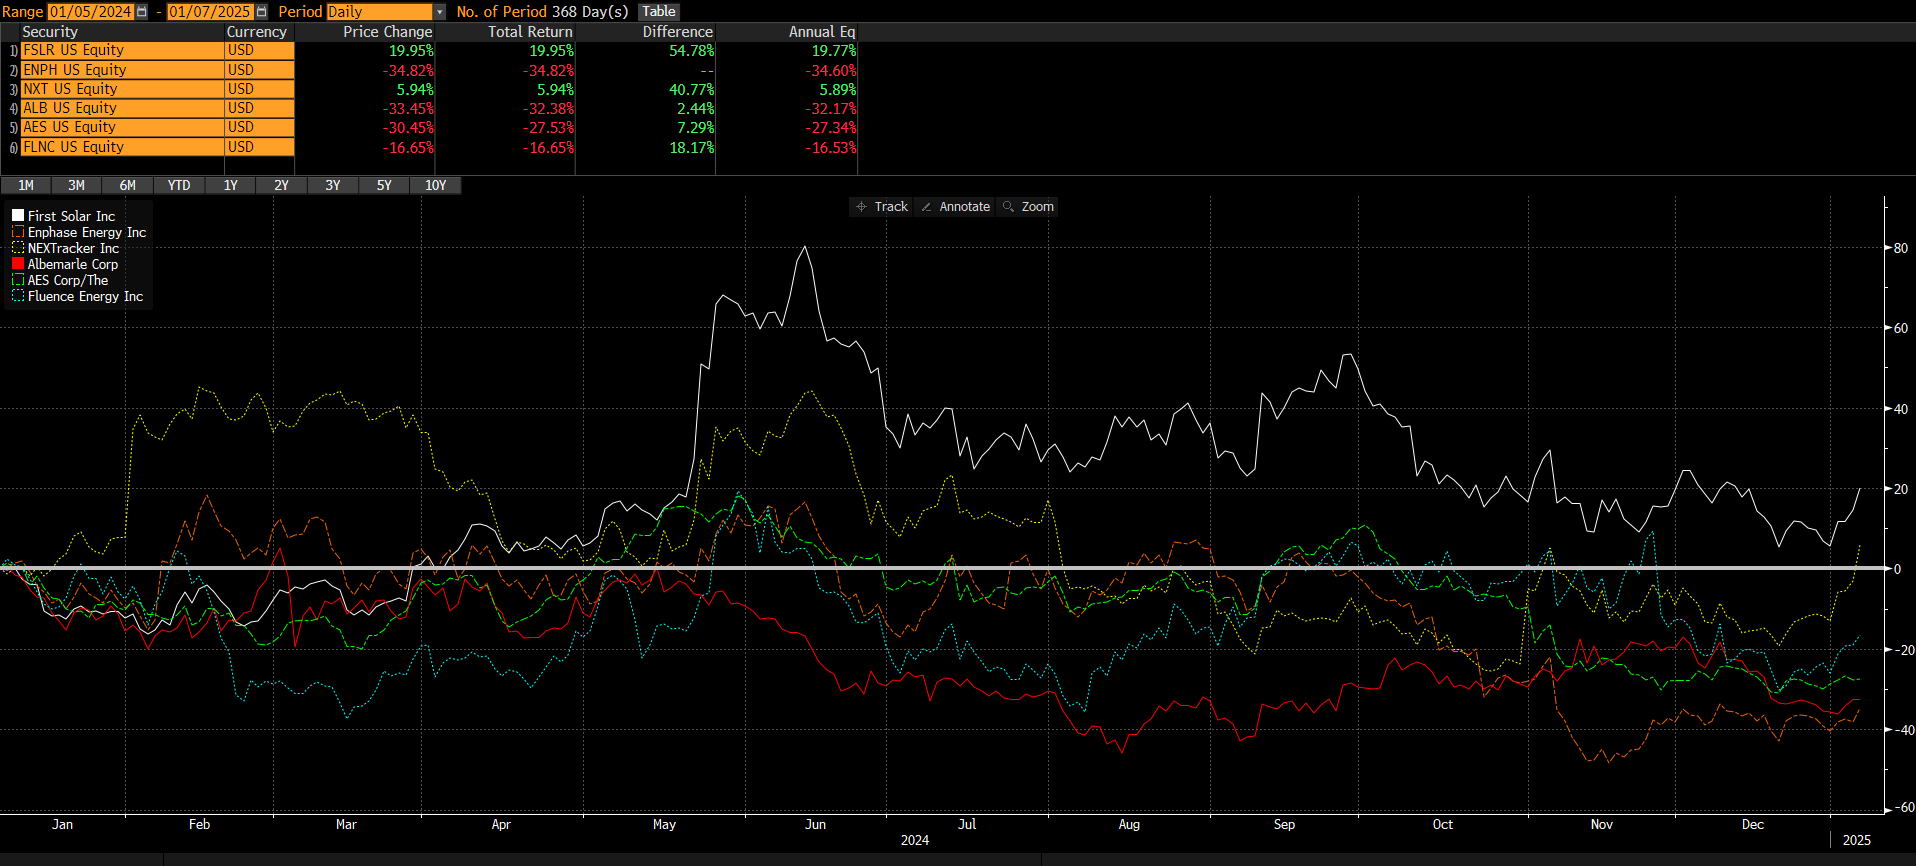 These challenges manifested in weak equity returns (as aforementioned) and substantial valuation compression across the sector (below). So what changed from when they worked in the few years before the last two? When looking at the past five years from a valuation perspective, you might notice that the large jump at the end of 2020/start of 2021 was due to a blowout of valuation multiples vs. substantial improvement in fundamentals. Since then, multiples have compressed. For example, EV/EBITDA multiples contracted from a level of ~20x+ to approximately <10x, while price-to-earnings ratios declined precipitously from 40x+ to <25x. It’s important to note that high and low multiples do not automatically mean companies are expensive/cheap as it depends on the type of growth they can deliver. Given the slowdown in traditional cleantech markets, the market saw a pairing of peak valuations combined with a broader reassessment of growth expectations in a higher interest rate environment - a formula that ensures disastrous outcomes. 5Y Cleantech Valuation Chart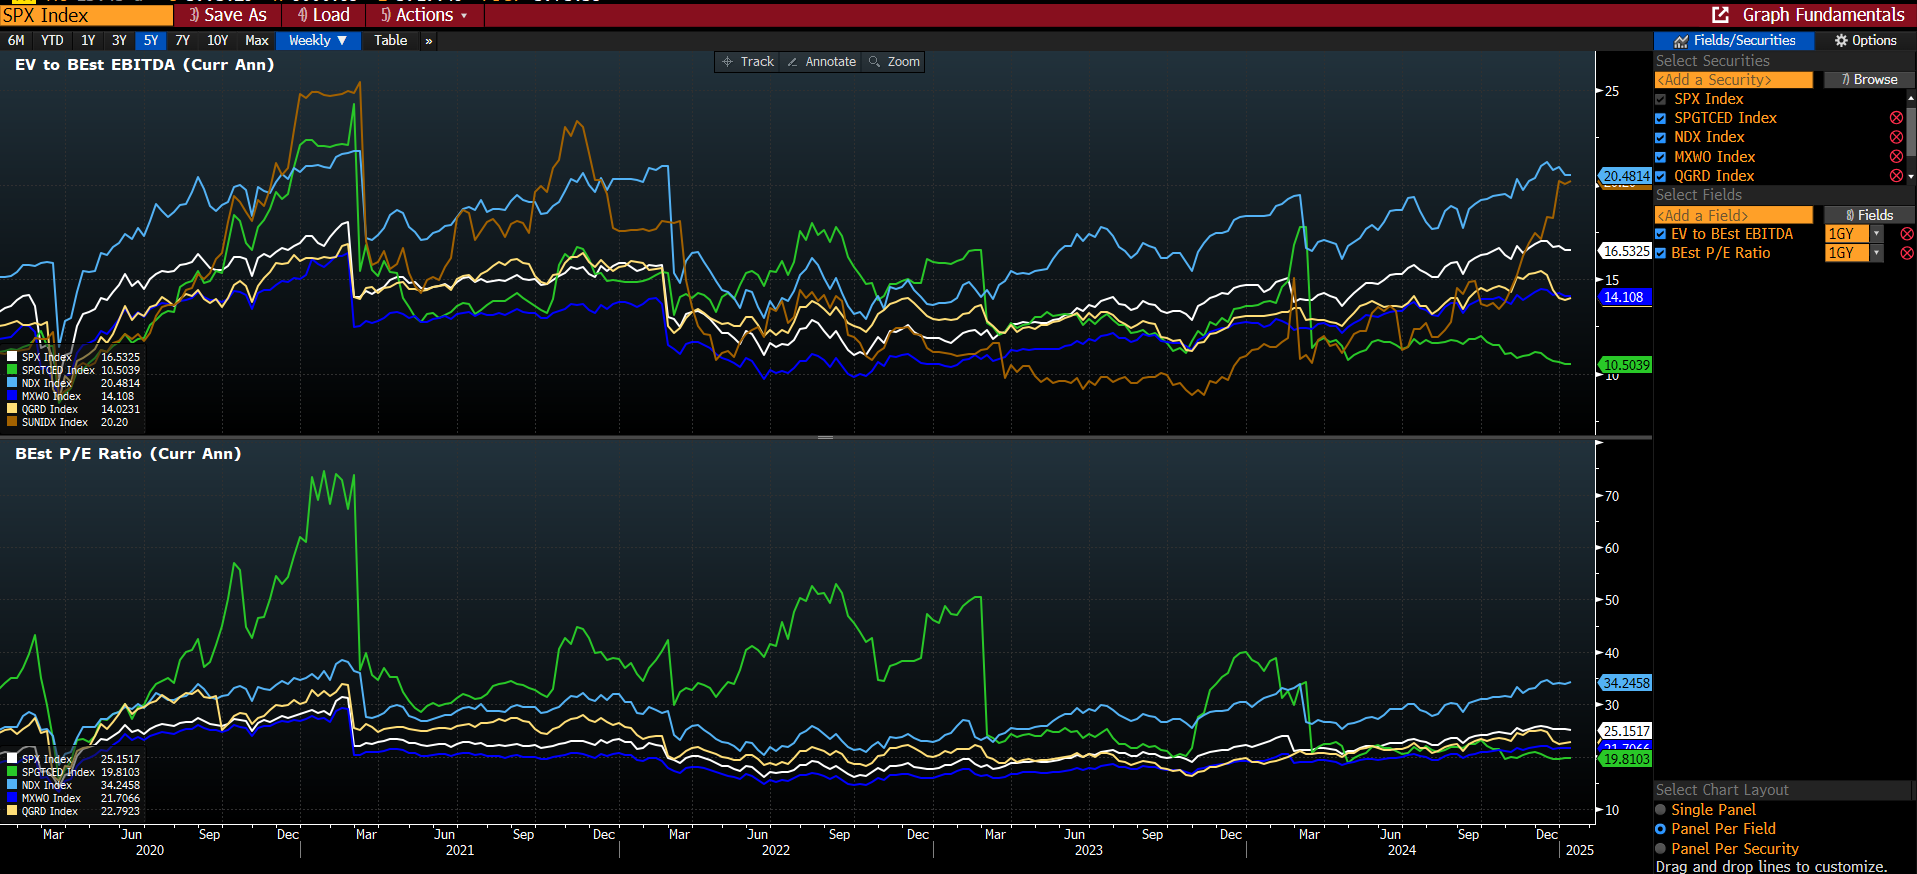
2) Cleantech-Adjacent Success Stories
In marked contrast, cleantech-adjacent sectors demonstrated remarkable resilience and growth throughout 2024. Electrical equipment providers benefited from accelerating investment in grid modernization and rising grid capex due to things like data center construction, electrification, increasing EV penetration, etc. HVAC manufacturers capitalized on strong payback periods and stringent energy efficiency regulations. Power generation equipment suppliers experienced surging demand driven by the unprecedented data center growth (see below McKinsey chart as an example). Engineering and construction firms secured record backlogs for infrastructure projects and continue to be labor-constrained to meet all the demand. These sectors maintained robust pricing power while delivering growth rates significantly above sector averages, typically in the high-single-digit to low-double-digit range. That formula often delivered double digit EPS growth. Their success stemmed from established market positions, proven technological capabilities, and exposure to secular growth trends in AI infrastructure and electrification. Select Cleantech Adjacent Stock Performance 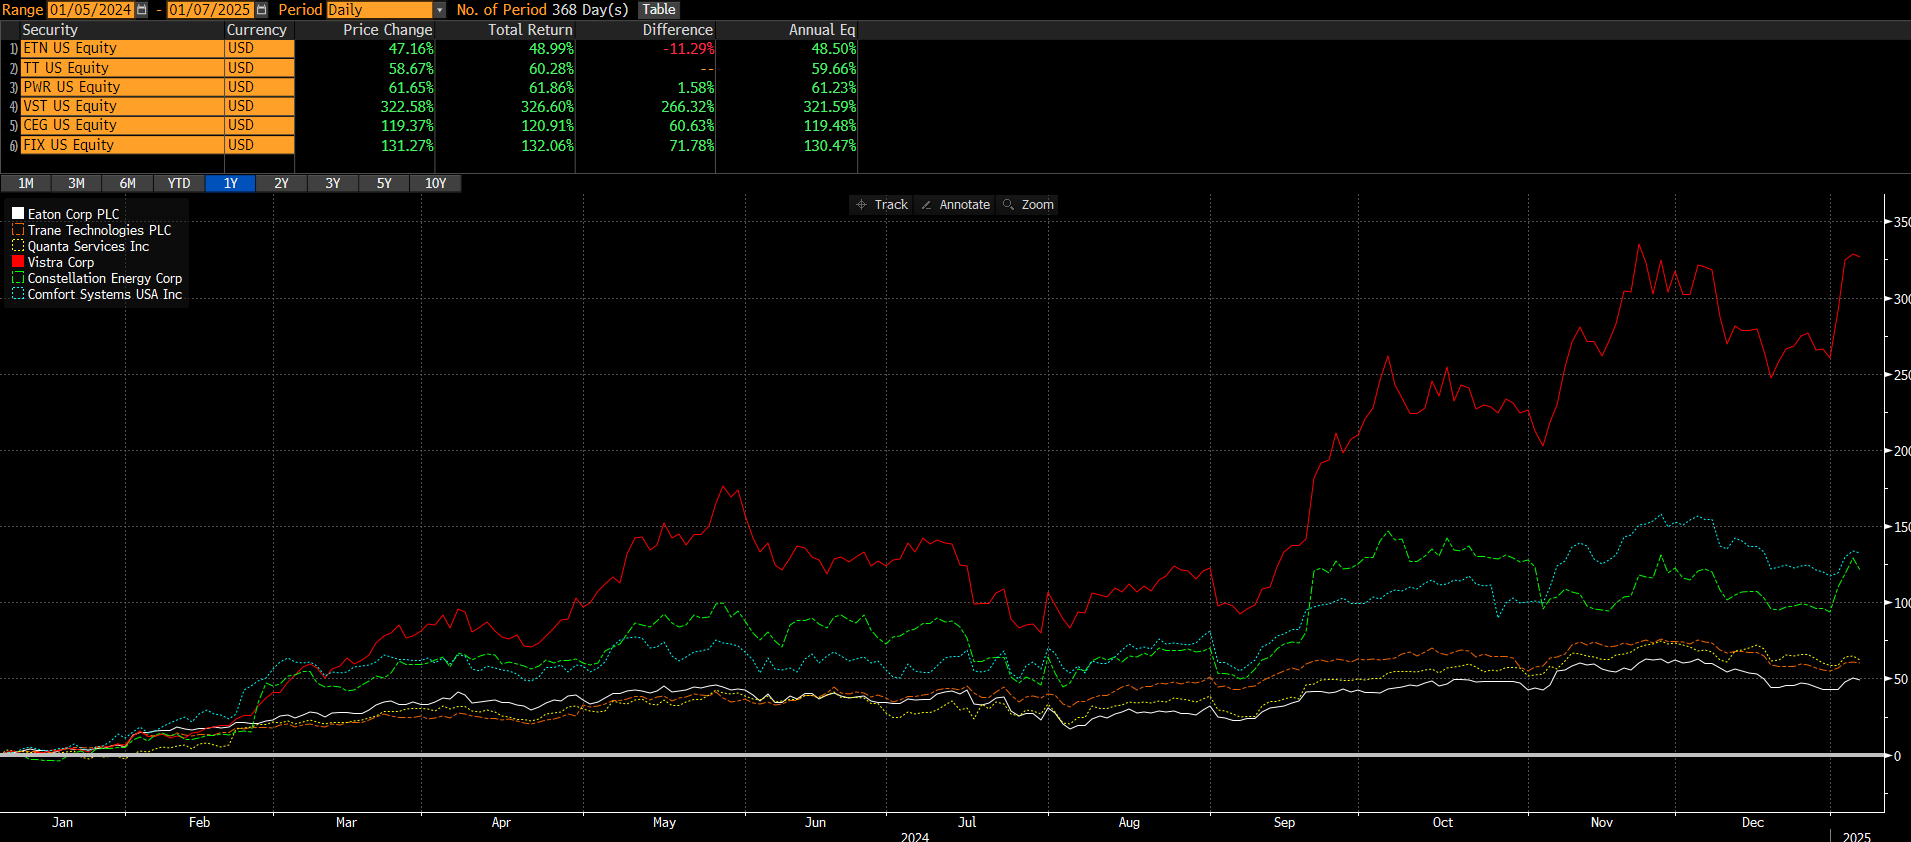
Key Themes Driving Performance 2024-2025
The AI and Data Center Revolution
The emergence of artificial intelligence as a transformative technology has created unprecedented demand for data center capacity. The forecasts below measure different things. Berkeley Lab’s December 2024 report estimated US data-center electricity consumption at 176 terawatt-hours (TWh) in 2023, with a scenario range of 325–580 TWh in 2028. McKinsey’s medium scenario projected 606 TWh in 2030, or 11.7% of US electricity demand. Grid Strategies’ 128-gigawatt estimate covered five-year growth in total US peak demand through 2029, including data centers, manufacturing and other uses. It should not be read as a data-center capacity forecast. This surge in power demand has catalyzed massive investments in power infrastructure and cooling systems, benefiting a wide range of equipment suppliers, service providers, engineering construction companies, and installers.
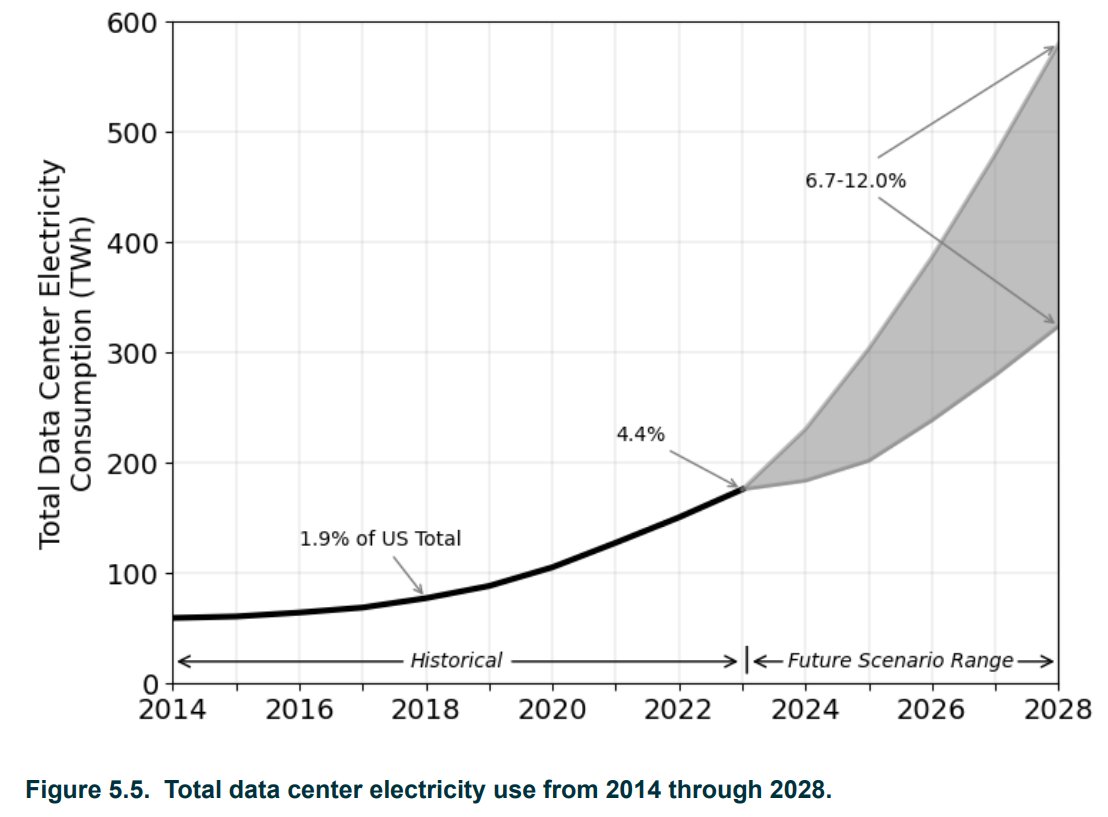
Source: Berkeley Lab, 2024 United States Data Center Energy Usage Report, December 2024, Figure 5.5. Open the full-size Berkeley Lab chart.
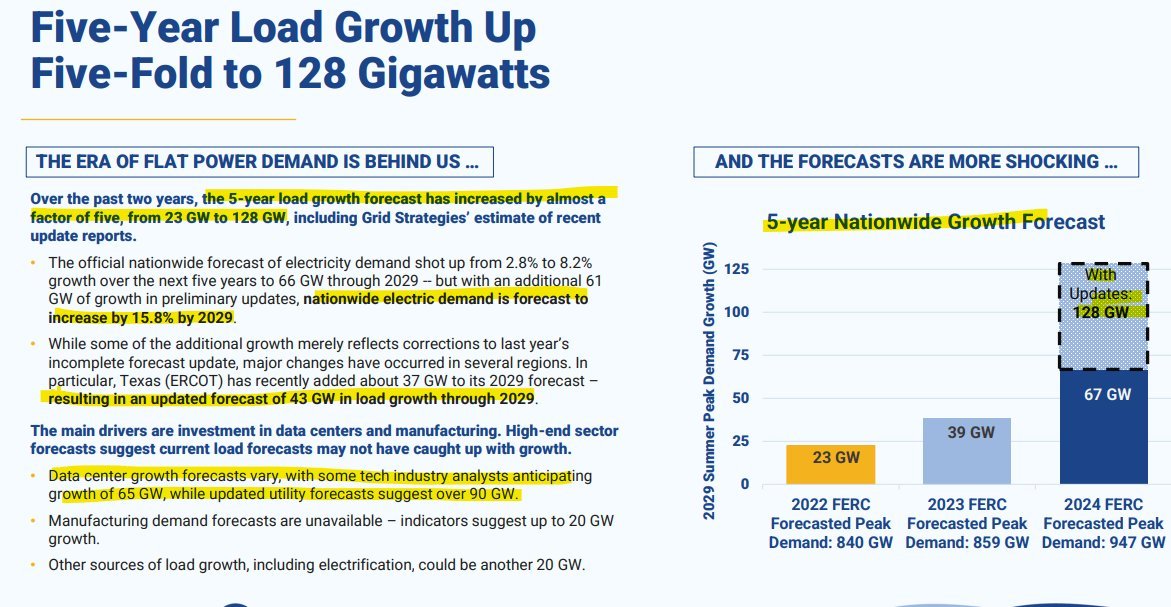
Source: Grid Strategies, Strategic Industries Surging: Driving US Power Demand, December 2024, page 3; original highlights retained. This measures total US peak-load growth, including manufacturing and other uses. Open the full-size Grid Strategies chart.
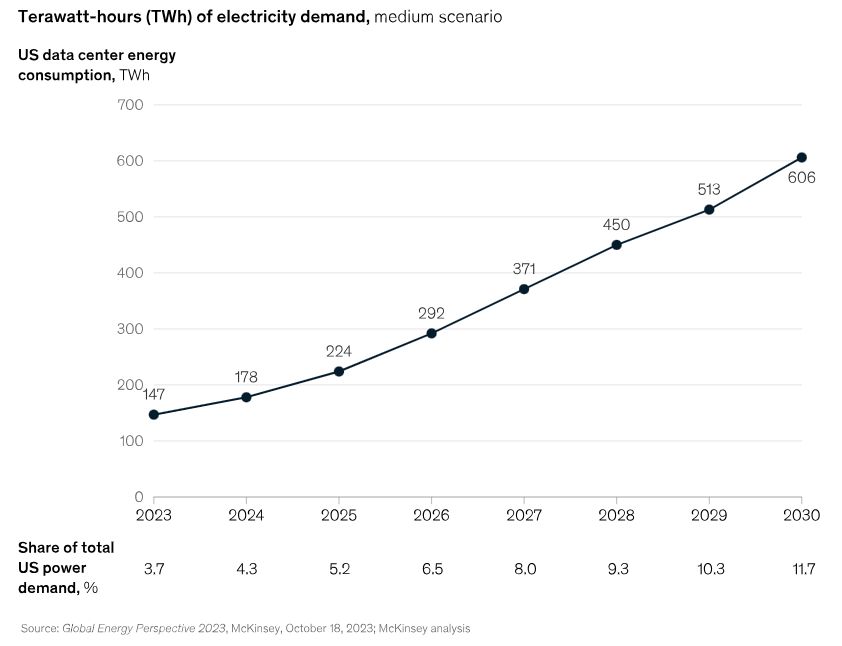
Source: McKinsey, AI’s power binge, November 6, 2024, using Global Energy Perspective 2023 and McKinsey analysis. Recovered from another crop of the same chart. Open the full-size McKinsey chart.
Grid Infrastructure Modernization
The utility sector has responded to growing power demands with aggressive capital expenditure increases, typically ranging from 25-50% above historical level depending on the utility (see thread here). These investments address not only data center power requirements but also broader grid reliability improvements and renewable energy integration needs, all of which are expected to accelerate. The scale of this modernization effort has created substantial opportunities for equipment suppliers and engineering services providers.
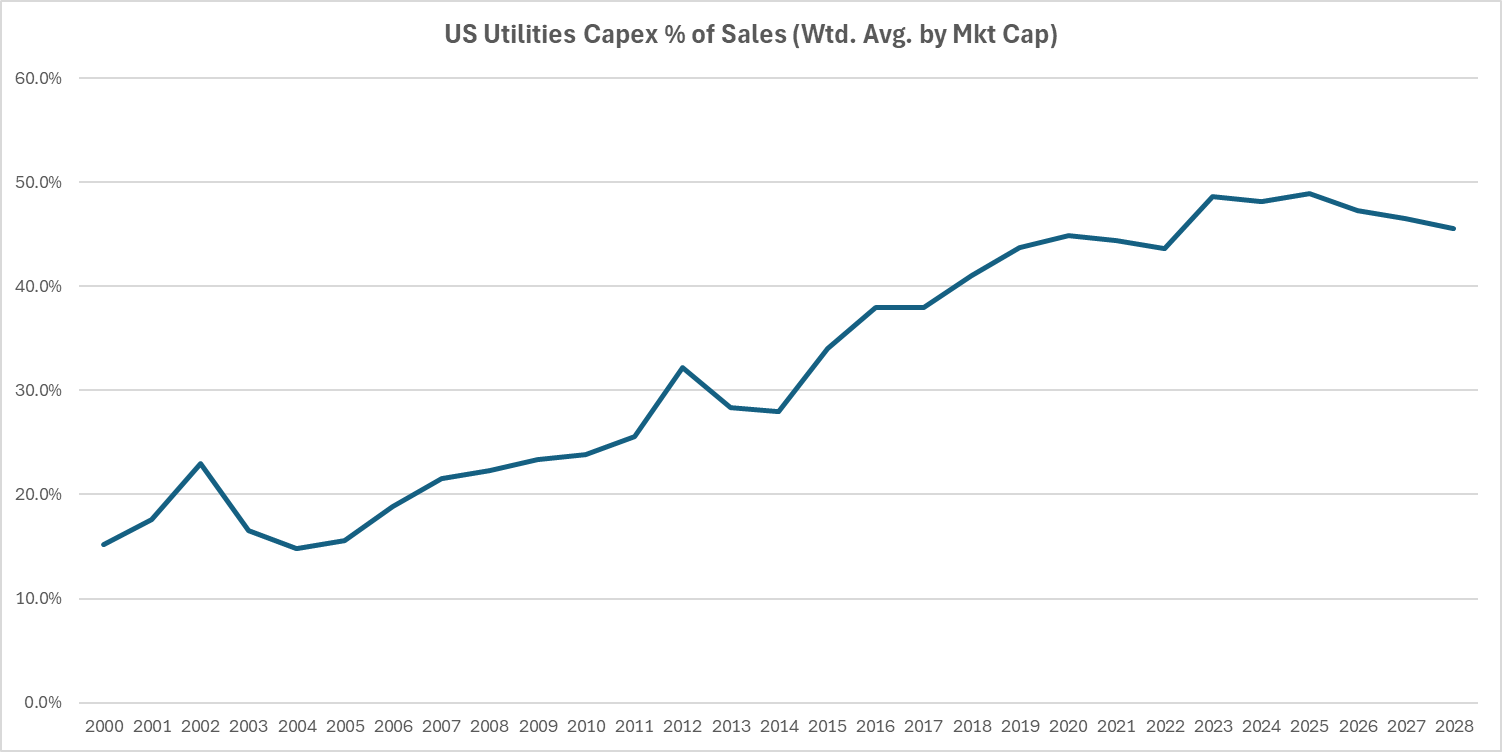
Source: author's calculations using Bloomberg data, October 18, 2024. Values for 2024–2028 are estimates from that date. Open the full-size utilities capex chart.
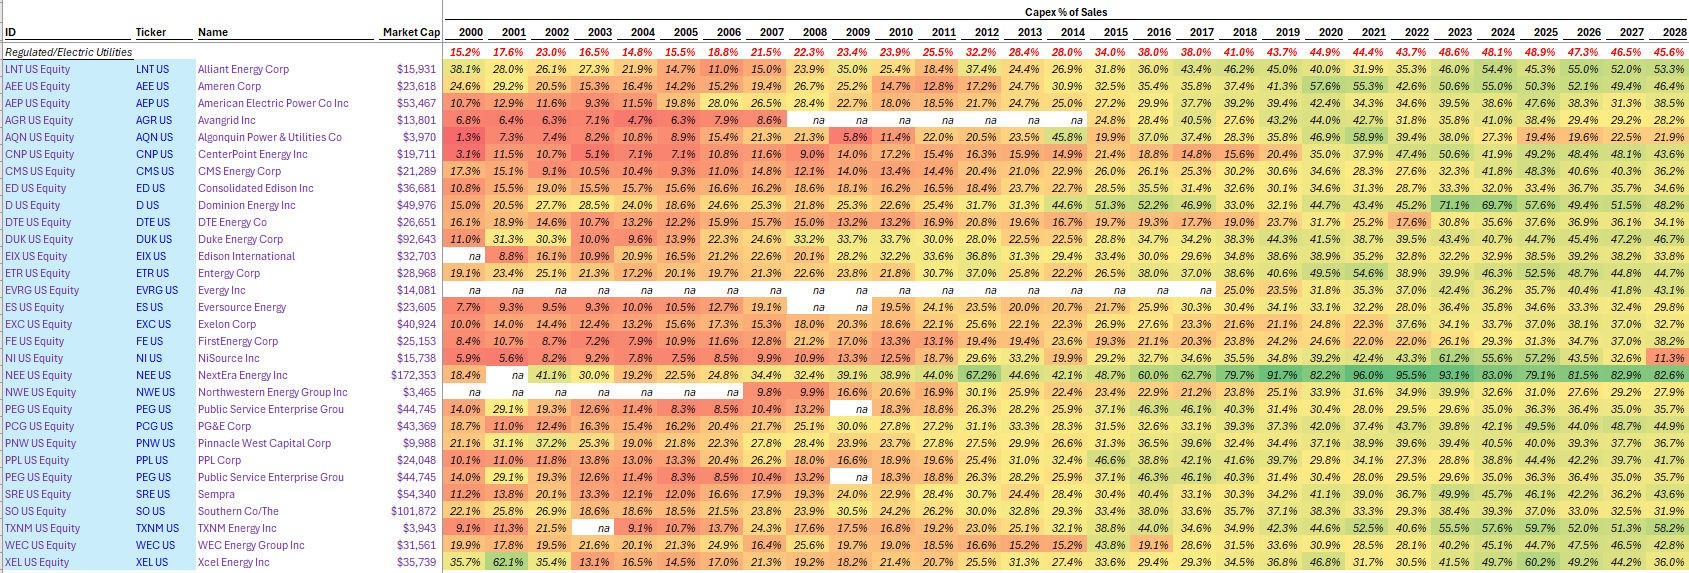
Source: the same October 2024 Bloomberg-based worksheet. Open the full-size utilities data table to read individual rows.
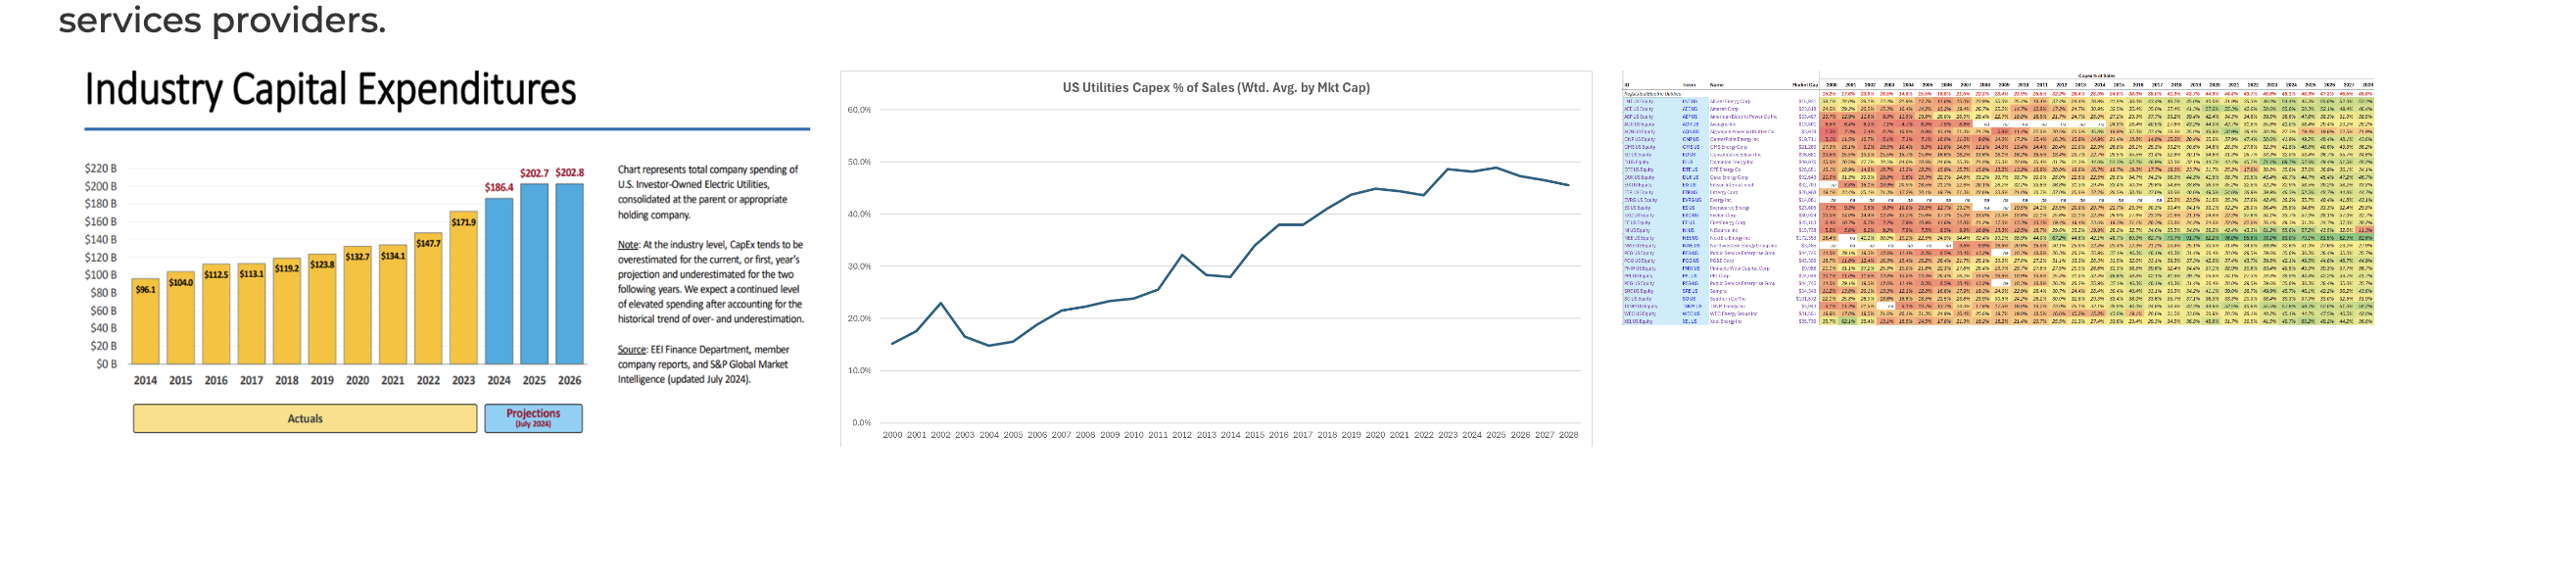
The missing EEI chart used July 2024 projections for US investor-owned electric utilities' capital spending: $186.4 billion in 2024, $202.7 billion in 2025 and $202.8 billion in 2026. That historical chart is reproduced on page 19 of Valmont’s April 2025 investor presentation. These figures retain the July 2024 forecast vintage. Open the full-size archived EEI and utilities panels to see the original chart within the saved page screenshot.
Thermal Power's Renaissance
Traditional power generation has experienced an unexpected resurgence in 2024 (look no further than GEV’s stock price and data point that we have the highest order growth rate in 2024 than in a decade!). Natural gas turbine orders have re-accelerated and there are credible views we can revisit the highs of early 2000s by 2030. Nuclear power has gained renewed attention to the baseload benefits of existing fission technologies and the promise of small modular reactor technologies. Major technology companies have demonstrated willingness to sign long-term power purchase agreements, providing crucial revenue visibility for new projects. See any of of numerous announcements (MSFT-Three Mile Island, Amazon-X Energy, Meta RFP, Google-Kairos). 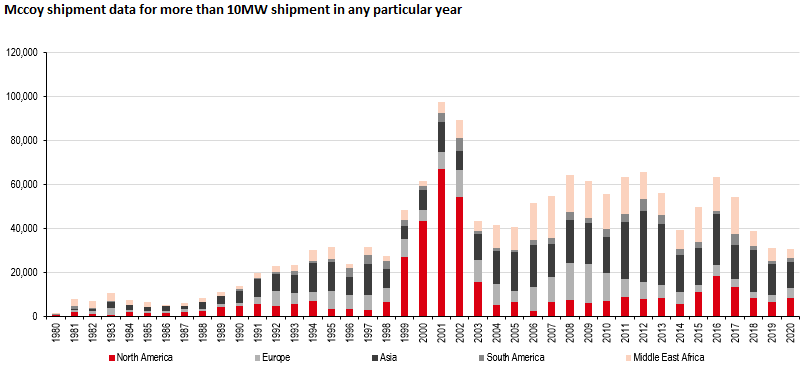
Manufacturing Reshoring
The continued emphasis on domestic manufacturing capabilities has generated additional demand across the industrial landscape. New semiconductor fabrication facilities, battery plants, and clean energy equipment production facilities have all contributed to robust growth in power demand and industrial construction activity. This trend has particularly benefited engineering and construction firms, which have secured record backlogs for infrastructure projects. All told, the run-rate annual spending on both Manufacturing and Data Center Construction now are in excess of $250BN+, >2x from the end of 2021. 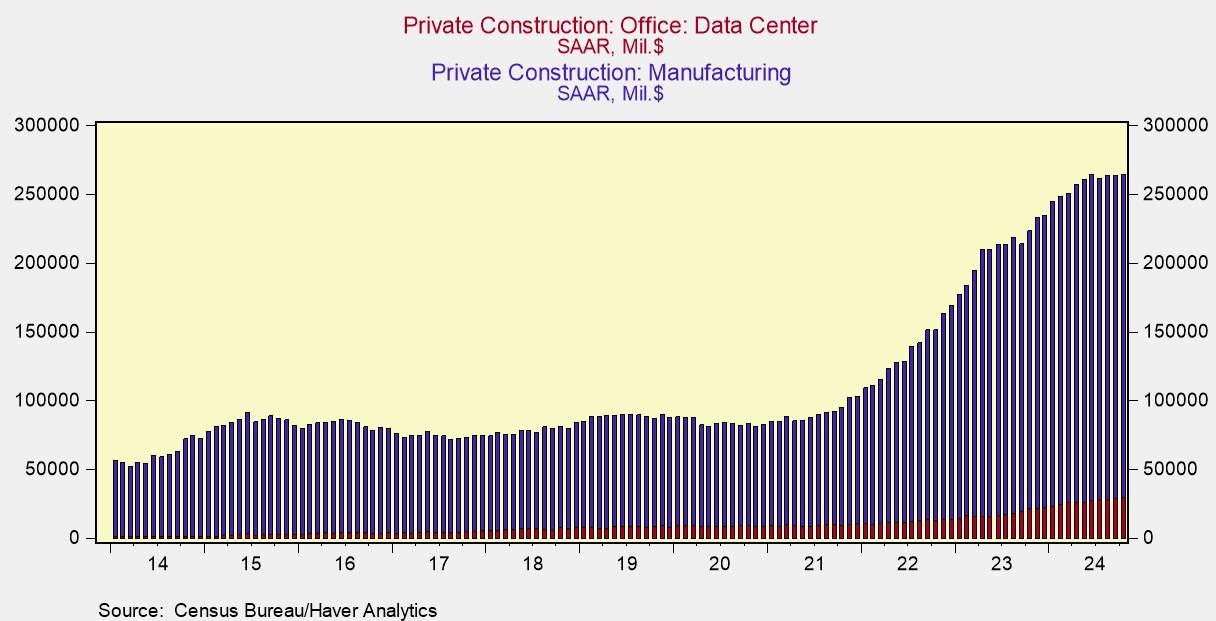
2025 Outlook
Looking ahead to 2025, several key opportunities and challenges emerge that will likely shape sector performance. The data center infrastructure buildout shows no signs of slowing, with power distribution equipment, cooling systems, backup power solutions, and service providers remaining in high demand. Grid modernization initiatives continue to accelerate, driving investment in transmission and distribution equipment, smart grid technologies, and renewable energy systems. However, significant execution risks remain. The industry faces persistent challenges in skilled labor availability, supply chain constraints (transformers, circuit breakers, switchgears 1-4+ year wait times), and permitting delays. Grid interconnection backlogs and access to power present particular challenges for new power generation projects. Additionally, market risks including interest rate uncertainty, potential regulatory changes, and international trade tensions could impact growth trajectories. The evolving landscape suggests companies with established market positions and proven execution capabilities are likely to continue to perform. Firms with exposure to data center and grid infrastructure projects, particularly those with strong pricing power, long-term service agreements and backlogs, appear well-positioned. Conversely, pure-play cleantech companies without clear competitive advantages may face ongoing challenges, especially those heavily dependent on government subsidies, with weak balance sheets amidst higher rates, or facing significant international competition.
Conclusion
As we enter 2025, the clean energy transition continues to evolve in unexpected ways. While traditional cleantech sectors work through their challenges, substantial opportunities are emerging in adjacent markets driven by unprecedented infrastructure demands. Success will likely favor companies with established market positions, strong execution capabilities, and exposure to secular growth trends in data center and grid infrastructure. The key to navigating this market will be distinguishing between temporary headwinds and structural challenges while remaining focused on companies with sustainable competitive advantages and rational valuations. While the energy transition remains a multi-decade opportunity, the path forward may look different than initially expected, with traditional industrial players potentially capturing a larger share of the value chain than previously anticipated. Things to pay attention to in the future may include:
- Data center construction starts & spending
- Utility capital expenditure plans
- Equipment order backlogs + Attach rate for service contracts
- Megaproject start/completion rates
Image restoration, September 18, 2026: Six individual chart copies have been restored. The other five historical panels are available through the linked, unedited page screenshots; their standalone original files remain unavailable. The EEI forecast is also summarized above. The original article date and historical forecast vintages are retained.